Loading Campussutras...

Turn Complex Enterprise Data into Interactive, Executive-Ready Visual Dashboards.
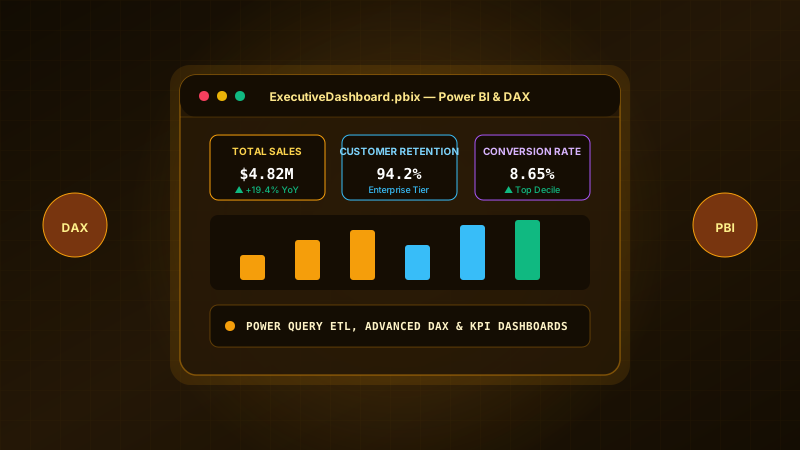
Modern organizations don't lack data—they lack clarity. Power BI has emerged as the global enterprise market leader for business intelligence, interactive reporting, and visual decision-making.
This 90-day bootcamp trains you to think like a seasoned BI Consultant. You will master data ingestion from multiple cloud sources, Star-Schema relational data modeling, advanced DAX (Data Analysis Expressions) calculations (CALCULATE, Time Intelligence, Iterator functions), Power Query M-code transformations, and Row-Level Security (RLS).
You will also learn how to leverage Microsoft Fabric Copilot for automated dashboard authoring, concluding with an interactive corporate supply chain command center.
Model complex multi-table enterprise data using robust Star-Schema architectures
Write performant DAX measures for dynamic KPIs, time intelligence, and variance tracking
Design clean, intuitive, accessible dashboards tailored for C-suite executive consumption
Configure Row-Level Security (RLS) to ensure multi-department data privacy and compliance
Publish, manage, and schedule automated cloud dataset refreshes in Power BI Service
Our industry-aligned syllabus is partitioned into 4 high-impact milestones, taking you systematically from core concepts to enterprise deployment.
Connect to disparate data sources, cleanse data with Power Query, and master M-code transformations.
You will build, test, and deploy production-grade software applications to create a verifiable GitHub portfolio that proves your capabilities to hiring managers.
Interactive Power BI dashboard monitoring inventory, shipping delays & vendor performance.
An end-to-end executive Business Intelligence dashboard tracking multi-country logistics operations across 50,000+ shipment orders. Built on a clean Star-Schema data model with 35+ custom DAX measures for On-Time Delivery % (OTIF), carrier freight cost variances, dynamic inventory turnover rates, customized Tooltip drill-down pages, and Row-Level Security restricting warehouse views by regional director.
Demonstrates high-level competence in data modeling, advanced DAX time intelligence, executive UX design, and secure cloud sharing.
Everything you need to know about the Business Intelligence & Dashboarding with Power BI program, mentorship, and credentials.
Excel is great for spreadsheet modeling, manual data entry, and ad-hoc calculations. Power BI is designed for large-scale corporate business intelligence: connecting to multi-million row databases, establishing relational models, and creating interactive, automated cloud dashboards.