Loading Campussutras...

Turn Raw Data into Executive Business Decisions — Master the Tools Every Company Relies On.
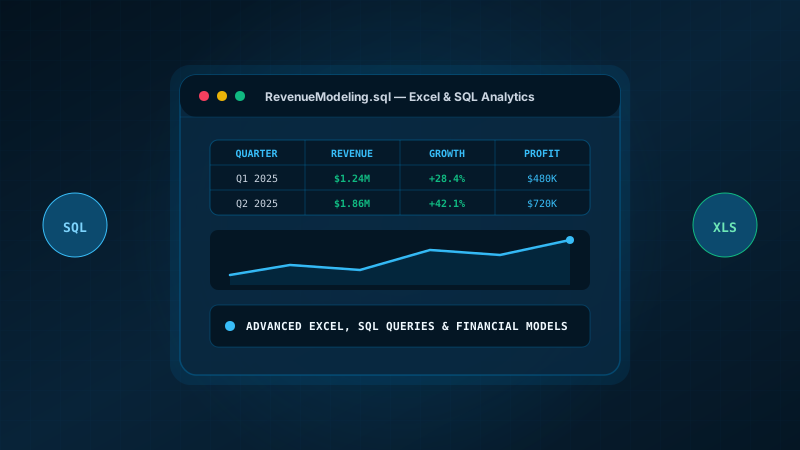
Every modern business—from high-growth startups to legacy enterprises—runs on spreadsheets and relational databases. This 90-day bootcamp equips you with the analytical toolkit demanded for Business Analyst and Data Analyst roles.
You will master Advanced Excel (dynamic arrays, XLOOKUP, INDEX-MATCH, What-If Analysis, financial modeling), automated ETL workflows with Power Query, and prompt-driven analysis with Microsoft Copilot. You will then dive deep into Relational SQL, writing complex multi-table joins, subqueries, Common Table Expressions (CTEs), and analytical Window Functions.
The program centers around real corporate case studies: customer retention, churn prediction, revenue forecasting, and executive reporting.
Construct automated financial and operational spreadsheet models using dynamic arrays
Cleanse, transform, and merge multi-table datasets automatically using Power Query
Write production-grade SQL queries using Common Table Expressions and Window Functions
Perform cohort analyses to calculate customer lifetime value (LTV) and churn rates
Synthesize analytical findings into clear, executive-ready presentations with visual charts
Our industry-aligned syllabus is partitioned into 4 high-impact milestones, taking you systematically from core concepts to enterprise deployment.
Master modern spreadsheet formulas, dynamic arrays, data validation, and lookup functions.
You will build, test, and deploy production-grade software applications to create a verifiable GitHub portfolio that proves your capabilities to hiring managers.
Enterprise business intelligence model analyzing 100K+ transactions using Excel & SQL.
A comprehensive business analytics capstone analyzing 100,000+ e-commerce transaction records. Features an automated Power Query data ingestion pipeline, relational SQL queries with Common Table Expressions and Window Functions to compute monthly cohort retention rates, customer churn indicators, RFM customer segmentation tiers, and an interactive executive Excel dashboard with dynamic KPI cards and scenario modeling.
Demonstrates practical competence in spreadsheet automation, complex SQL querying, and executive business decision-making demanded by analytics hiring managers.
Everything you need to know about the Business Data Analytics with Advanced Excel & SQL program, mentorship, and credentials.
No programming background is required! Excel and SQL are designed for business logic and analytical reasoning. We start from the fundamentals and build up to advanced modeling step by step.